Where to See Berkshire’s Apple Sell-off Info

This post primarily aims to quench my curiosities in the fastest way. Heavily reliant on my judgement and intuition.

Written from scratch by Meston Ecoa


Findings:

1. Once he made up his mind about reducing position, he executed a portion even when stock dipped 192->171.
2. When the stock rebounded, he kept his stance on having to need to reduce position and aggressively reduced position happily since the market offered better prices.
3. Through 1H, BRK performed worse than SPX. BRK’s equity investments, cash holdings also performed worse than SPX. It’s inevitable when you are realizing returns or cash out. 
4. Therefore, I should have a pre-established view that is independent of near-term stock price

Where to See Berkshire's Apple Sell-off Info

Source: cnbc

Introduction

Asia crashed today. it’s August 5th. Nikkei and Kospi is both down 10% in one day. Seems like major hedgefunds and Warren Buffet managed to sell ahead of the dip and have a lot in cash reserves.

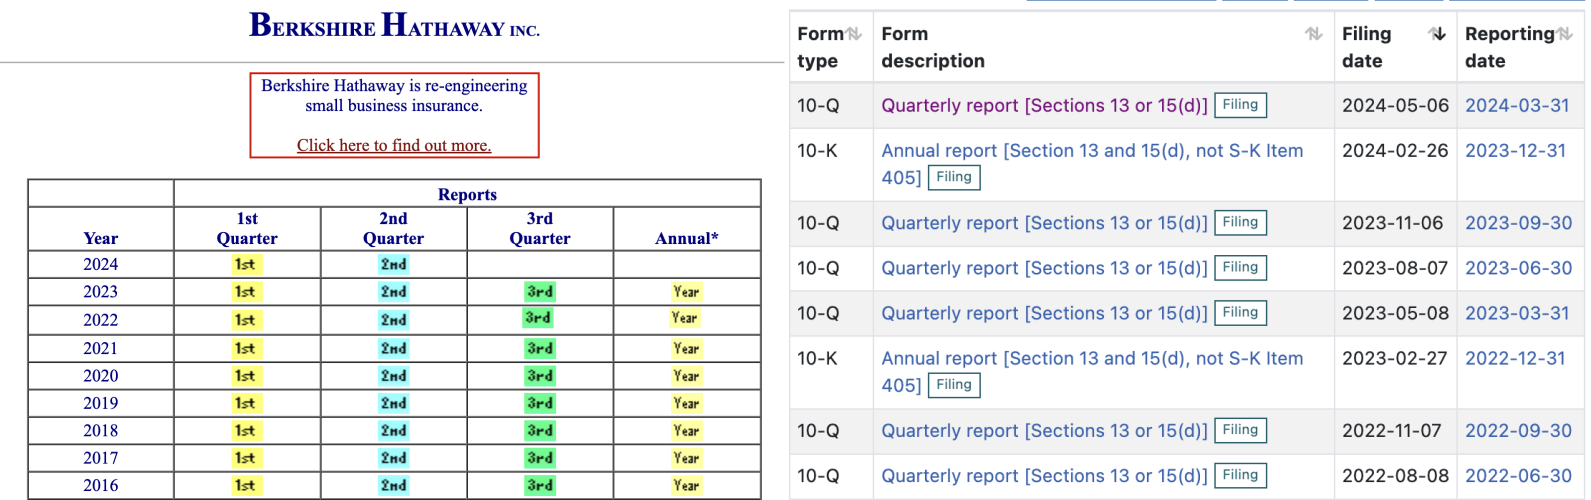
This was an article from Aug 3. That’s a Saturday. I rushed to find the original source. But I couldn’t find it on sec.gov My guess is that it’s because it’s the weekend? I don’t know how customary this practice is, but I was under the impression that sec would be the control tower of information dissemination.
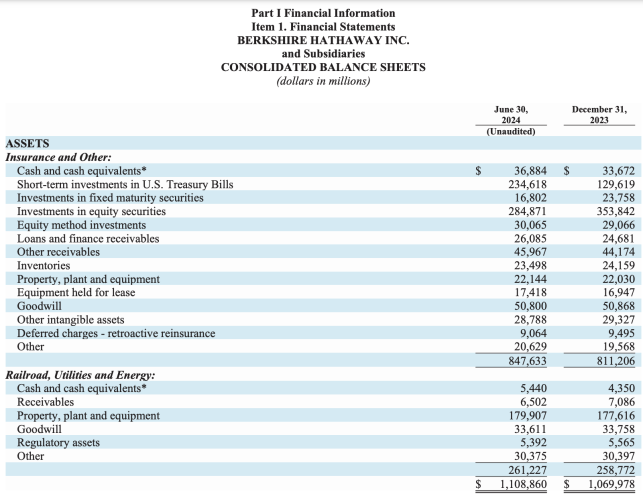
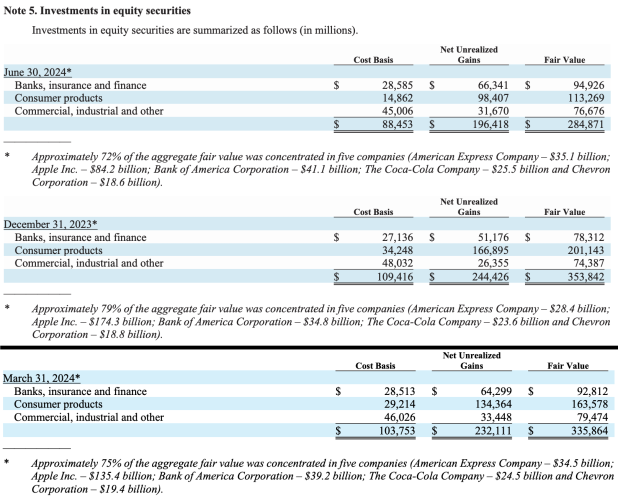
Anyways,

Source: Berkshire Hathaway, SEC


Below is the infamous 24Q2 10-Q. Articles would say Berkshire piled up $277bn in cash. That’s the sum of Cash and cash equivalents and Short-term investments in U.S. Treasury Bills. Quite easy. 
 
$277bn is surely a jump from Dec 31, 2023’s $167bn. Exactly a $100bn drop. However this should be sized relatively to total assets or something. Say the market went up, but Berkshire made some bad investments so it lost. Then the drop doesn’t say much about the oracle’s insight, only the lack of it.

From January to June, SPX grew 15%. BRK.A grew 11%. Buffet’s total assets grew 4%. The first four of entries under Insurance and Other grew 6%. Looking more closely into the first four items under Insurance and Other, the sell-off is more apparent. The company sold off stocks and bought short-term bonds, which still yields 5%.

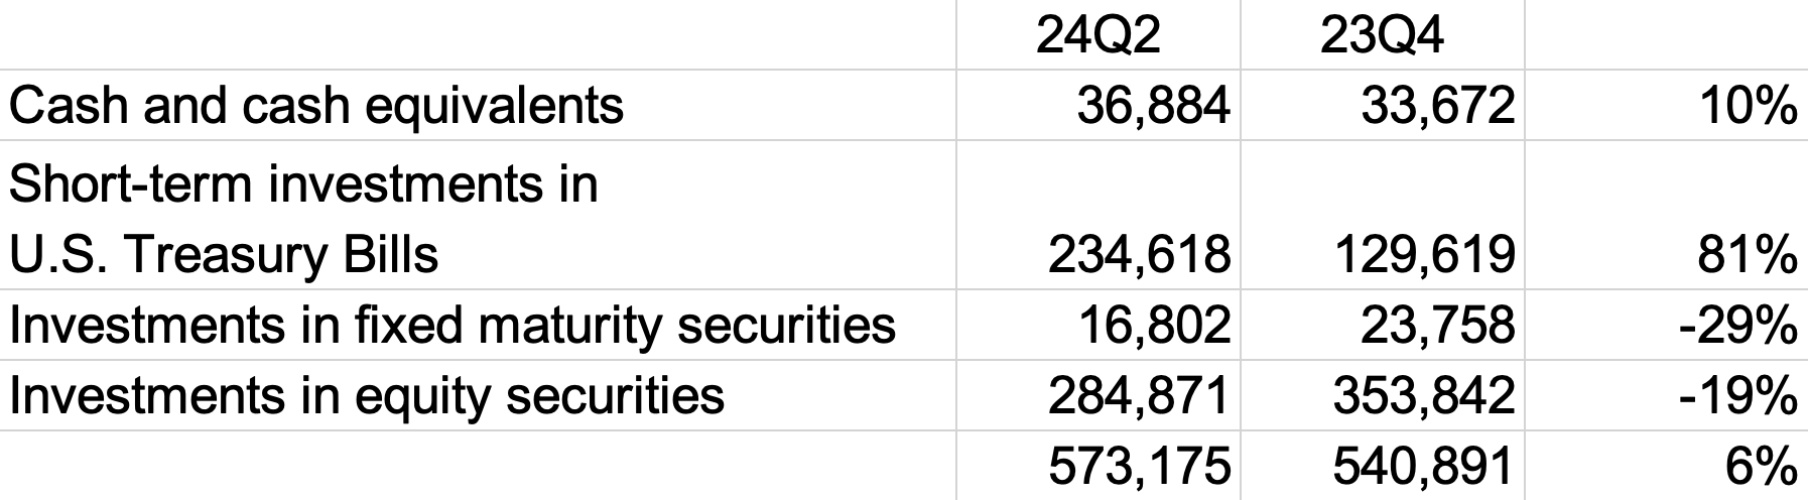
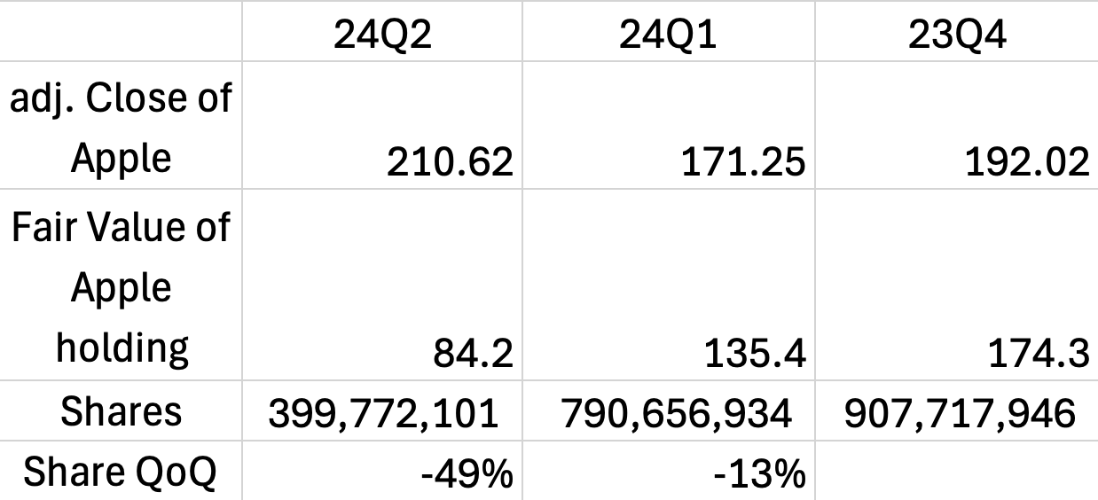
The relevant part indicating the Apple sell off is below. The Fair Value column’s total is the same as what’s shown in the Balance Sheet. $284,871 and $353,842. I added March 31 figures from 24Q1 10-Q.

Articles said Berkshire sold 49% of Apple holdings. It was not hard to get. I’m just trying to breath in how consistently this guy has been realizing returns. Buy and hold forever. Warren Buffet doesn’t do that. Let’s burn that into my brain.
 
 
He sold more in Q2 than Q1. The stock price of Apple dipped in Q1, it surely rebounded in Q2, making his exit more favorable.
 
1. Once he made up his mind about reducing position, he executed a portion even when stock dipped 192->171.
2. When the stock rebounded, he kept his stance on having to need to reduce position and greatly reduced position.
3. Through 1H, BRK performed worse than SPX. BRK’s equity, cash holdings performed worse than SPX. It’s inevitable when you are realizing returns or cash out.
4. Therefore, I should have a pre-established view that is independent of near-term stock price
 
I’m wondering if I could do this for a longer term so that I could see the trend. Also I’m hoping to plot this against forward p/e and spx p/e, maybe yields too.

Written from scratch by Meston Ecoa

May contain incorrect data and information

Leave a Reply

Your email address will not be published. Required fields are marked *