This post primarily aims to quench my curiosities in the fastest way. Heavily reliant on my judgement and intuition.
Written from scratch by Meston Ecoa
PRICE STH IN
Source: Cambridge Dictionary
🤓 Cambridge dictionary defines “price sth in” like this. At times like this when the rates are high, yet the public seems to want rate cuts, it’s all over the news. Although, tbh, I haven’t seen many people who talk about rates. Probably it’s Wall Street talking on behalf of people. 😂
These are the type of articles that I’m talking about.
• “Bond Traders Boldly Bet on 300 Basis Points of Fed Cuts by March ” – Bloomberg
• “Traders abandon hopes of March interest rate cut but keep betting against Federal Reserve” – FT
• “Treasury yields rise as traders assess timeline of interest rate cuts” – CNBC
• “Traders scale back bets to two BoE rate cuts this year” – FT
Upon coming across these articles I want to get some answers. I’m going to wrap my head around this.
Q1. What financial instruments are used to "price in" their outlooks?
Q2. Can I have direct access to data source?
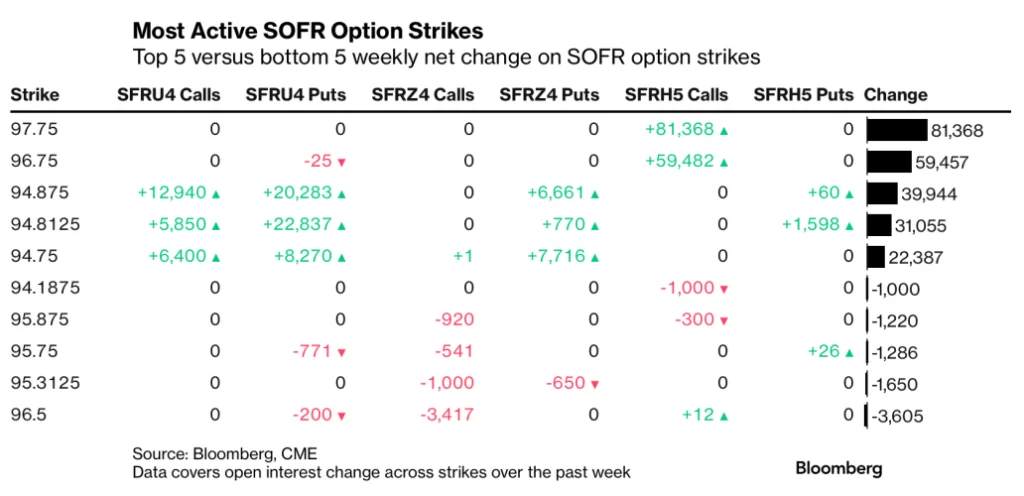
Source: Bloomberg
Bloomberg has a recurring chart appearing in their regular bond market updates. I think this is potentially the end point of where I’ll get to. I’ll look into this.
THE OBVIOUS
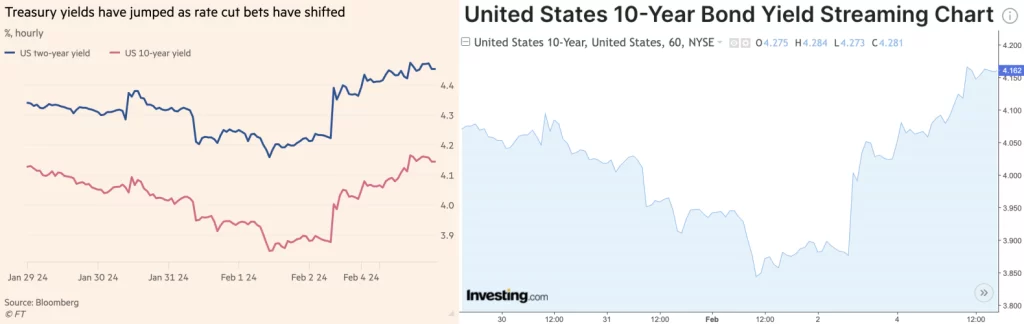
Source: FT, Investing.com
The obvious instrument would be treasuries itself. Treasuries get issued all the time. When new infusions of bonds will have lower coupon, or so we think, the existing bonds which have higher coupon becomes more attractive, making their price go up. It goes up until the effective yields are unattractive enough to be indifferent from getting a new issue, instead of something already floating in the market. This is how I would describe it.
OTHER INSTRUMENTS

Scene from The Big Short – Badass Michael Burry enters contracts with investment banks to short the housing market
At any given moment there’s a myriad of ways to bet on anything, it seems especially on Wall Street. TreasuryDirect account isn’t a must to get Treasuries exposure. For example, ETFs like SHY provides a way to get exposure to US bonds that expire in 1-3 years.
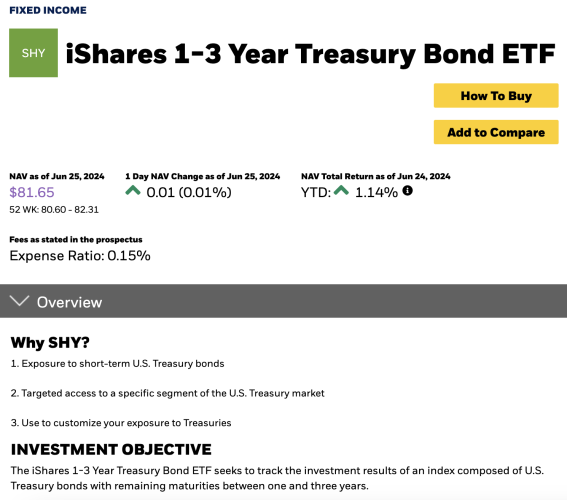
Source: iShares
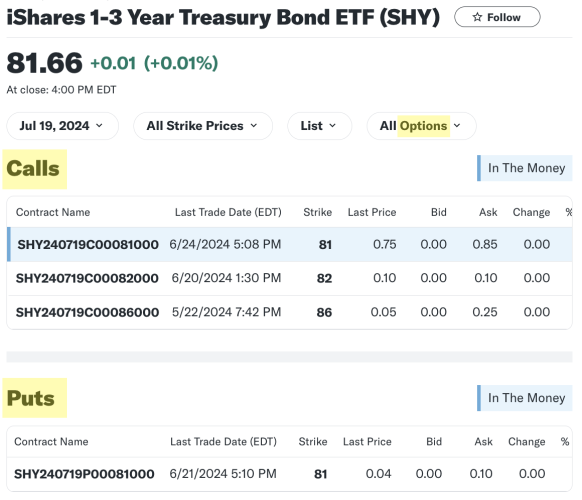
Source: Yahoo Finance
How to get more leverage? Also so many ways. Technically, if you lend money from someone else and buy double what you were going to buy while paying interest, that’s leverage. There’s also options on SHY. Right now, I want to look into look into SOFR futures and options from CME.
Sub Q1: What makes trading SOFR futures and options more attractive than options for SHY to institutions?
Sovereign Overnight Financing Rate - FRBNY
Source: New York Fed
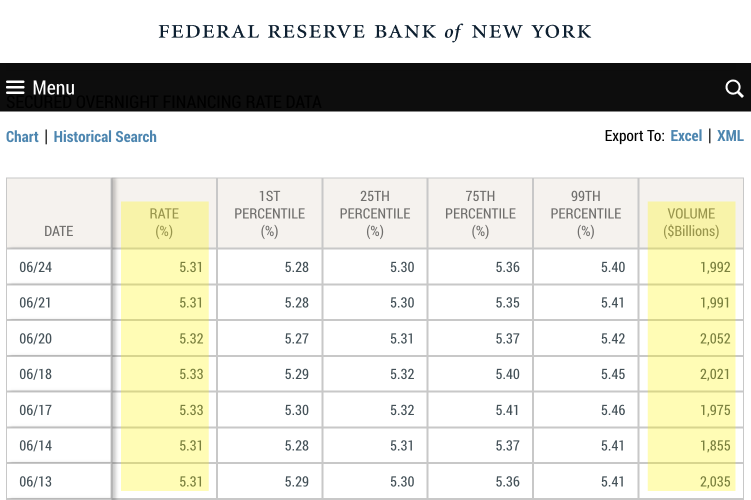
“The Secured Overnight Financing Rate (SOFR) is a broad measure of the cost of borrowing cash overnight collateralized by Treasury securities. … The SOFR is calculated as a volume-weighted median of transaction-level tri-party repo data collected from the Bank of New York Mellon as well as GCF Repo transaction data and data on bilateral Treasury repo transactions cleared through FICC’s DVP service, which are obtained from the U.S. Department of the Treasury’s Office of Financial Research (OFR).”
I think it basically means that SOFR is a ultra representative number for what the interest rate is for super safe overnight loans. How representative? It aggregated total sum of loans reaching $1,992bn on a recent night.
Cooking SOFR
Source: CME
In the previous table from FRBNY, we know the SOFR for each day 6/13 – 6/24. They are 5.31, 5.31, 5.33, 5.33, 5.32, 5.31, 5.31 for each day the market opens. 11 days in total. Of course these are annualized rates, no one would give you 5% overnight.
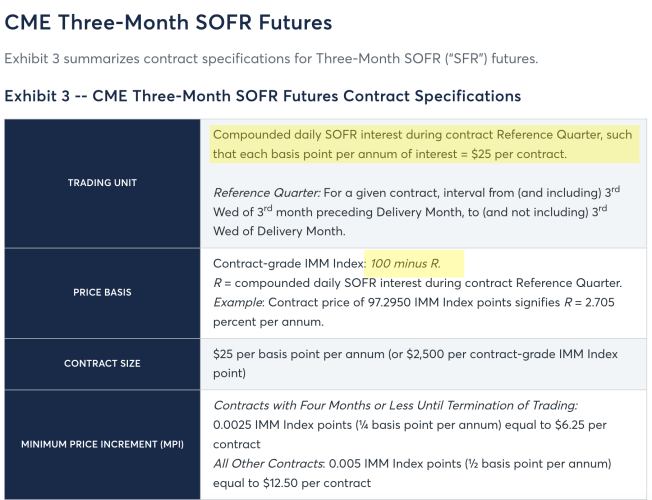
What CME does is something like this. They decided back in January of the same year to make a game of predicting the number “x” which is the weighted average of SOFRs for each day in the 11-day period in June. More or less. Except it won’t be 11 days, but 1month, or 3 months. And you’ll be predicting “100-x” not “x”. Which is kind of the same thing.
SOFR Futures
Source: CME
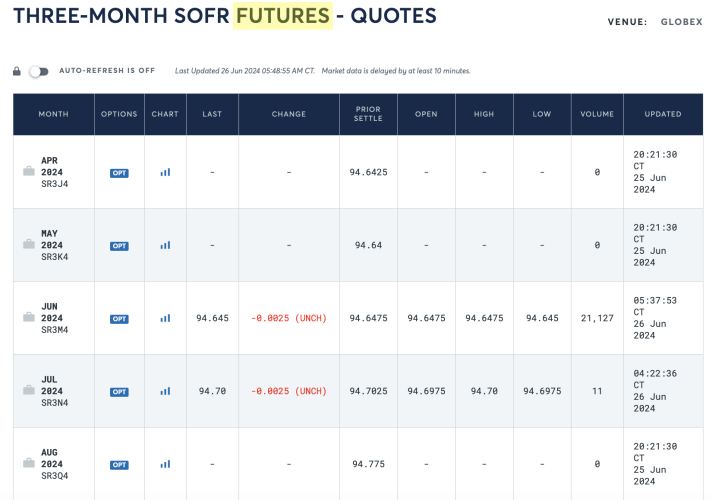
For example, “MAY 2024 SR3K4” means the target number of guessing is the weighted average of daily returns from the three month window starting May. That’s why it’s currently June, but this future has not expired yet. Also, the figure 94.64 is the 100-x value, which means that x is 5.36. We know 5.36% is around the neighborhood for yields nowadays. Just as a quick sense check.
Options on SOFR Futures
Source: CME
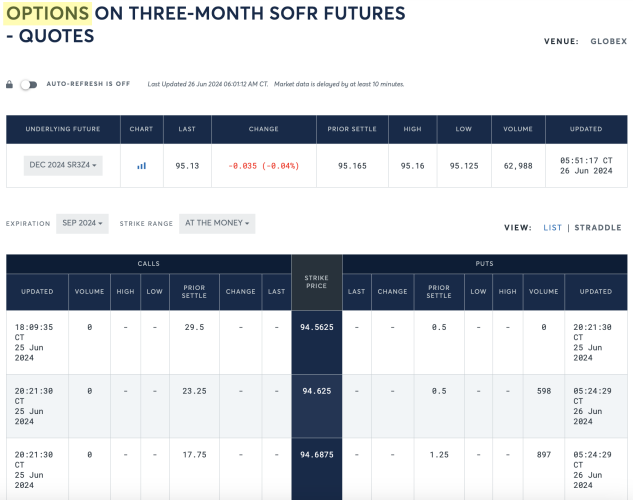
Options have an expiration date. Futures have an expiration date. They don’t need to be the same. That’s why we can specify the “UNDERLYING FUTURE” date as well as “EXPIRATION” for the option. So, here it will show the premium on the options for a given strike price for a given future.
How to Tell if Investors "PRICED IN" Rate Forecasts
Source: CME
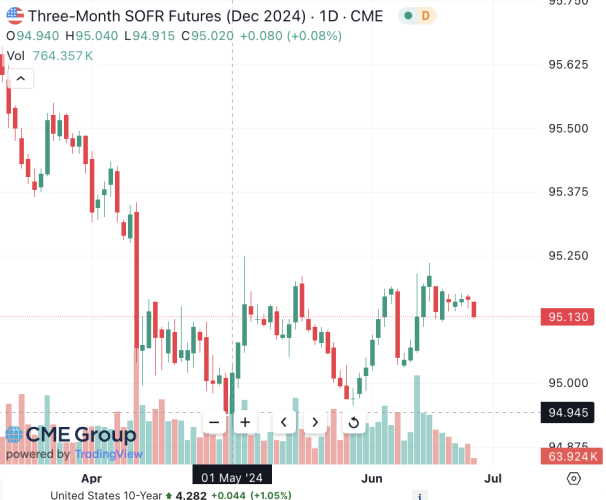
First, I can look at where the future is trading at. For Three-Month SOFR Futures (Dec 2024 – that is, the weighted average from December to March), since the low in May 1, the chart is on the rise. Back then, people in general were expecting 1Q25’s rates to be around 5.06%. As of today, 4.87%
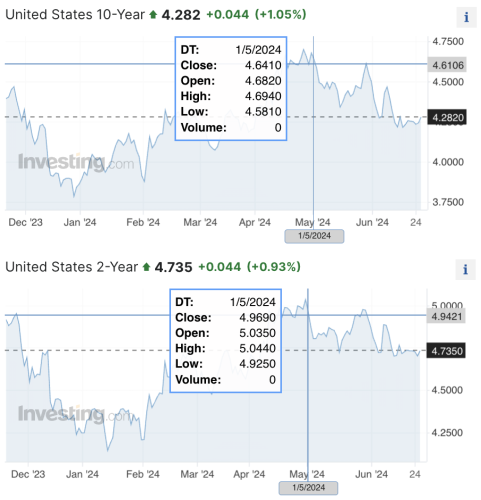
I thought I might try to compare this with Treasury spot yields. My guess was whatever sentiment that’s in the bonds market would be shared, but doesn’t seem like they are in sync. After all, they pertain to distinctly different time frames.
I realize that futures and spot data isn’t enough. Option’s ability to specify the strike price gives investors more freedom. On my end, it gives more hint into the exact figure that traders are thinking of, instead of a vague directional bet. For example, if an investor takes a long position in a SOFR futures contract or bought SHY, all I can deduce is that she thinks rates will fall and the price of the bond will rise. We can’t tell what she thinks the fair value is. I need to look at options data.
Options of SOFR Futures Data
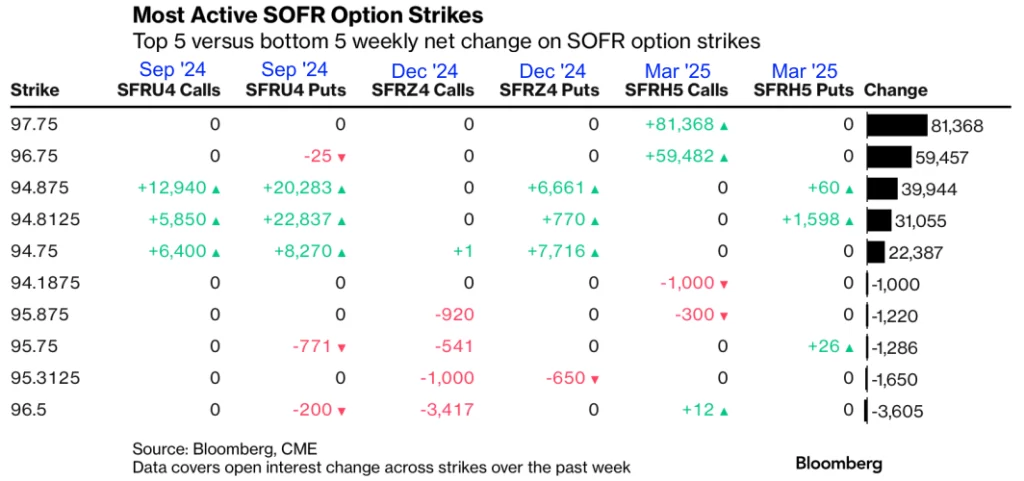
Now I look back on the same table in the introduction of this post. It makes more sense. SFR is the Bloomberg code for Three-Month SOFR Futures (SER for 1 month) Strike and the change in open interest over the past week betray the volume of sentiment for a specific number. In this case, 2.25% (100-97.75=2.25) for the weighted average of daily SOFR from December 2024 to March 2025. In order for this call option to be profitable SOFR should be lower than 2.25%.
Source: MacroMicro
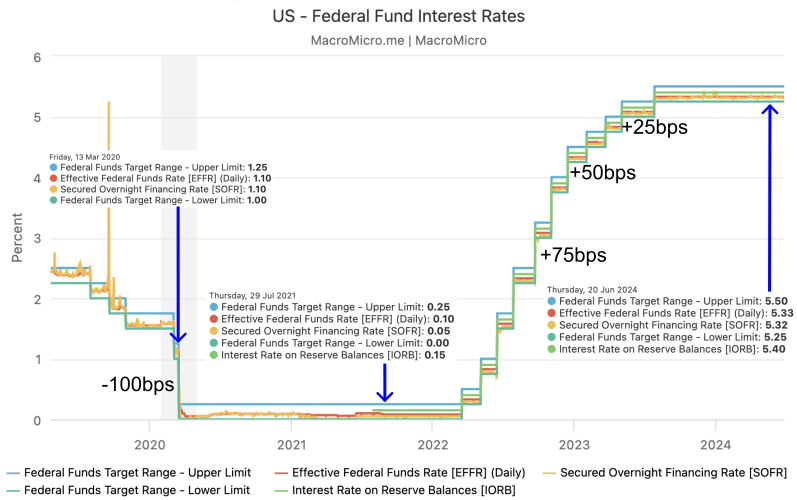
Fed discloses data. Like this one. I preferred the graphics on MacroMicro so opted for this. So Fed meets 8 times a year. There are 4 left in 2024. Including Jan 2025’s meeting, then 5 meetings until Three-Month SOFR Futures (Dec 2024)’s destiny will be finalized. More or less. Historically, Fed has shown that when it needs to take hikes or cuts, it will do quite successively. It rose rates from 0.25% to 2.25% from Jan 2017 to Dec 2018 across 8 meetings. Then cut rates from 2.25% to 0% from July 2019 to March 2020 across 5 meetings, including the 100bps drop in the break of covid. Of course, then we have the series of hikes in 2022 and 2023.
I don’t think there is an official limit to how big a change Fed can make per meeting. It has been one of these four until now – baby step (25bps), big step (50bps), giant step (75bps), 100bps.
A drop of 325bps across 5 meetings is what it takes for this position to be profitable. The article from Bloomberg mentions that it’s an aggressive position given that the market is pricing in 75bps drop by then, and 125bps drop by end of 2025. And that this could be a wager to hedge another position.
Perhaps what I need to see is the ratio of these niche bets compared to other bets. Also, maybe open interest could be a metric to how much variance in views exist in the market? I’m also curious how one would choose options of which expiration date. Say one KNOWS that SOFR is going to be 2.25% in Jan, Feb, Mar 2025 and wants to profit by buying call options for Dec 2024 futures. It is now June 2024. Do they buy the option expiring in Mar 2025? Maybe Dec 2024? Maybe Sep 2024? – I’m guessing they optimize based on the current premiums offered for the different expiration and assess if they are profitable enough.
Sub Q2: how does the volume of these 300bps-cut bets compare to the aggregate open interest in F&O?
Sub Q3: One has knowledge into 1Q25 data in June 2024. Options of which expiration would be the best?
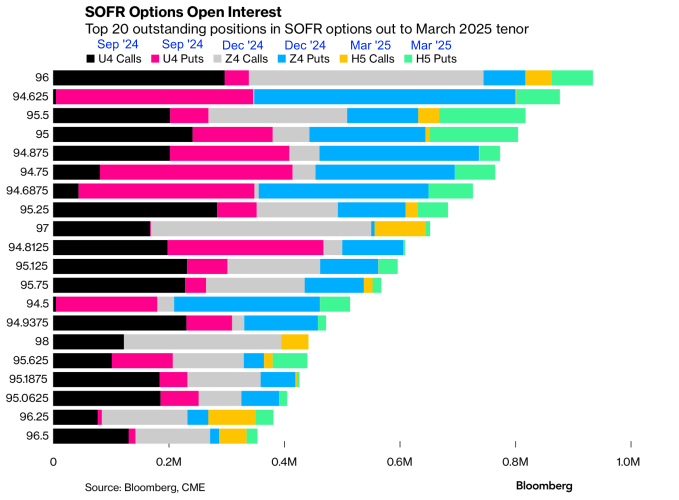
As was asking myself sub Q2, the same article provided a chart on SOFR options open interest. The 0.081M open interest for the strike of 97.75 doesn’t appear here. It’s probably because they sorted by open interest per strike in descending order. I don’t really get the implication of this chart. What’s for sure is that the +81k in open interest for 9775 call isn’t big by any means compared to the aggregate.
Source: CME
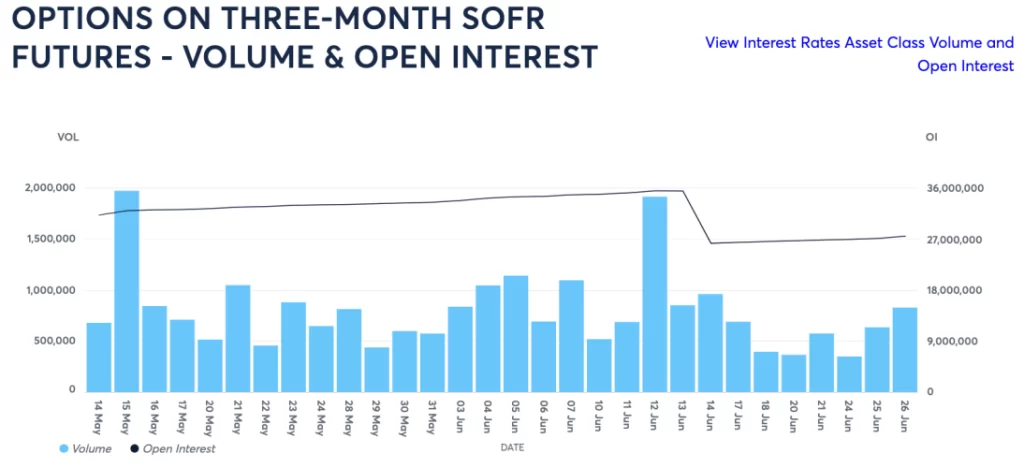
Speaking of volume, this is data on CME. There wasn’t a section to specify future of which maturity, but I think it defaults to SR3Z4, which is the Dec 2024 one. Or judging from the drop in OI in June 14 and boost of volume in June 12, maybe it’s an aggregation of volume and OI for all the different maturities. I might send an email to CME on this matter. Anyhow the OI for June 26 is around 27 million.
Source: CME
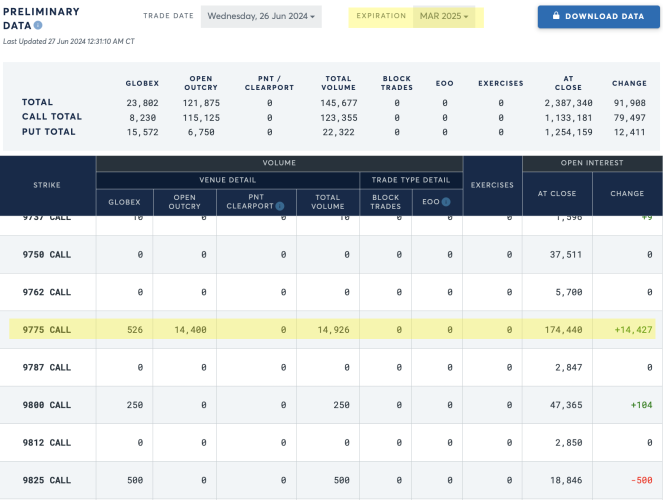
In this section I’m able to identify the expiration of the option, but it still doesn’t show the expiration of the underlying future as well. Anyhow I think the boost of +81k in OI is included in the highlighted section. Also, the total open interest the this expiration seems to be about 4.5 million. This is mark the end of the sense check.
Regarding Accessible Data
Data seems to be very limited. I want to see the OI and Volume for all dates, for all expiration of futures, for all expiration of options. Also data on CME seems quite limited. Obviously, they have a paid data plan. There are some data on Barchart.com, but it somehow the expiration of the option and the underlying future is tied. :/
Next time, I might try to actively scrape data from CME and look into it.
Written from scratch by Meston Ecoa
May contain incorrect data and information