This post primarily aims to quench my curiosities in the fastest way. Heavily reliant on my judgement and intuition.
Written from scratch by Meston Ecoa
NUCLEAR GATES
Source: CBS Interview on Youtube
Power demand talk is everywhere. I’ve seen it from too many sources that I thought it is overdue for me to wrap my head around it. Most recently, I’ve seen Bill Gates on CBS preaching the necessity of nuclear power in the United States. Here are some highlights of the interview.
This is a huge subject so I need to start small. I know some basic information about nuclear power. Each generates around 1GW of power. Radioactive materials are used to heat up water. The heated steam will turn the turbines and voilà.
• “We have discussions with utilities about building tens of these but you know we really only have huge impact and success if we get past 100.”
• “Demand for electricity in the United States for the first time in a long time is going to go up quite a bit. It’s electric cars, buses, some people use electric heat pumps in their homes. And just in the last year with these artificial intelligence breakthroughs all the big AI companies are saying okay we need to build lots of data centers. And so if we don’t have nuclear to complement the wind and sun, the country will fall behind the demand for electricity.“
• “The goal is to get rid of all emissions by 2050. Even that’s pretty ambitious. All of the clean sources will have to do a great job of getting their cost down.”
• “Our design, that(after-heat problem) goes away because since we use sodium to cool everything it
can absorb all that heat. Those accidents were both first and second generation reactors. The third generation reactors dealt with that with a lot of complexity so those reactors are quite safe, but the cost overruns meant that the electricity will be very very expensive. We solved the the safety problem with a much simpler approach but we had to start from scratch.“
Q1. What is US electricity generation per technology?
Q2. How many nuclear plants are there in the US
Q3. Demand for electricity going up quite a bit
"for the first time in a long time"?
Q4. What are gen 1,2,3 reactors
and how is Terrapower's sodium different?
Basic US Power Stats
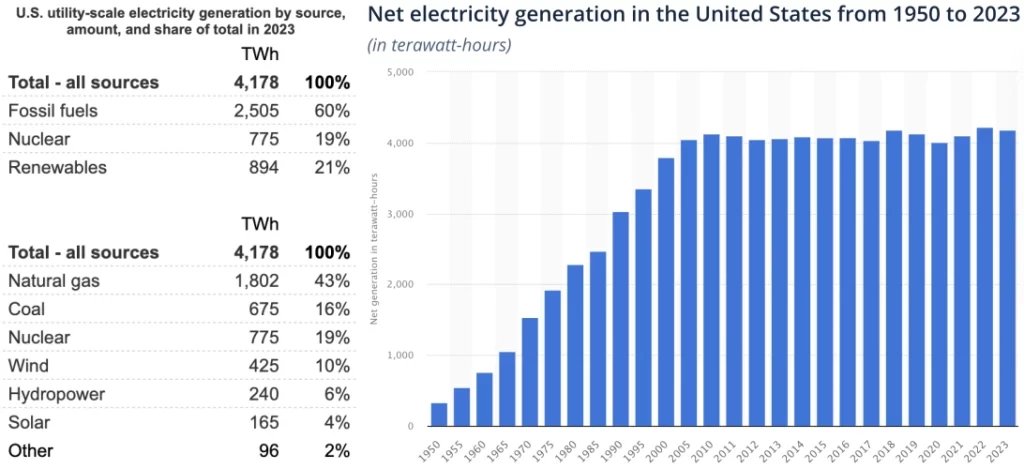
US consumed 4.2PWh (it’s kWh – MWh – GWh – TWh – PWh with 1000x increments) in 2023. Nuclear accounted for 20%, around 800TWh. I didn’t know Natural gas accounted for the most in the US. Well, now I know. Gates was right in saying “Demand for electricity in the United States for the first time in a long time is going to go up quite a bit.” Electricity generation has stayed flat since 2010. I wonder why. Maybe generation capacity built until then was sufficient to support the population. Also, possibly renewables installation sufficiently offset the decommissioning of fossil fuel & nuclear plants. Or, behind-the-meter PV growth was quite substantial. The US population did grow. It was 280million in 2010 and 330million in 2022.
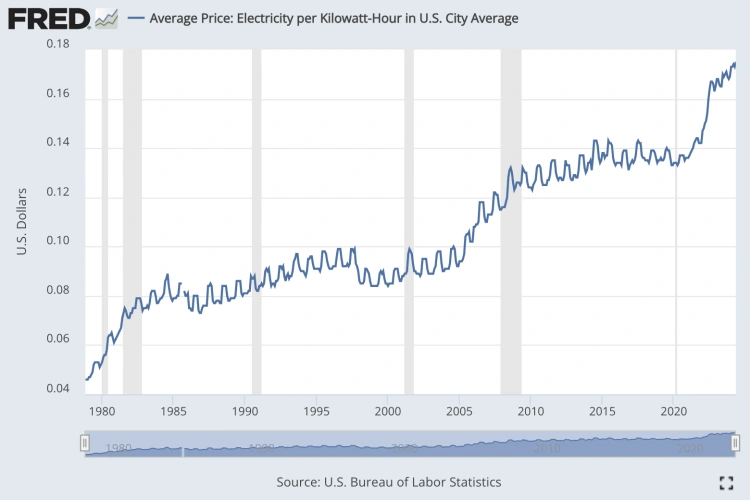
Source: FRED, U.S. Bureau of Labor Statistics
US electricity price does seem to flatten out from 2010 to 2020. This somewhat explains why further capacity expansion was not necessary. The spike since 2020 explains why Gates would want to expand into nuclear.
Map below is the type of visuals that would be in reports and everyone would expect them to be there, but no one would actually look into. I don’t. But I will now.
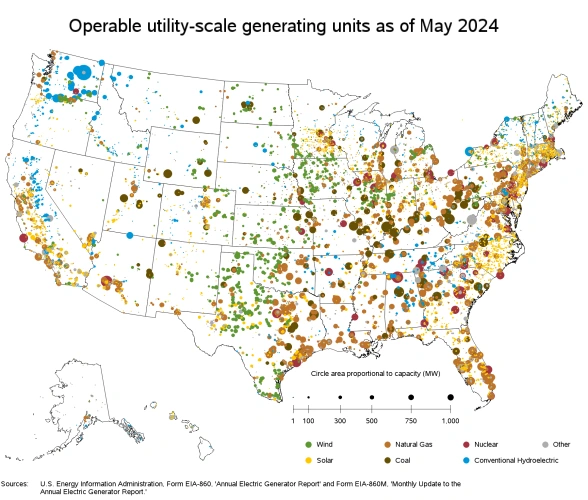
NUCLEAR: This map actually doesn’t tell much about nuclear. They seem scattered. Each plant seems close to a big city, probably to serve the population’s electricity demand. Nuclear is meant to account for 20% of the generation. But to me the dots doesn’t seem to add up to 20% :/ Possibly because nuclear is overshadowed by other dots, especially in the northeast region.
COAL: Most coal plants seem to be in the midwest and south area. I’m guessing they would be away from the city and closer to the mines.
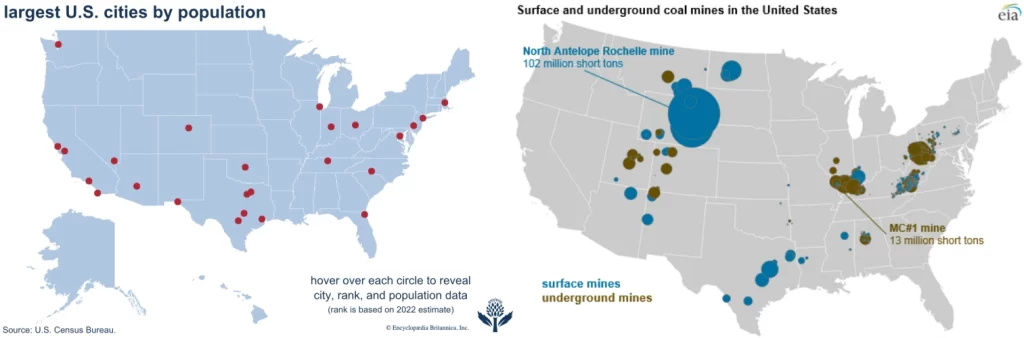
Source: Britannica, EIA
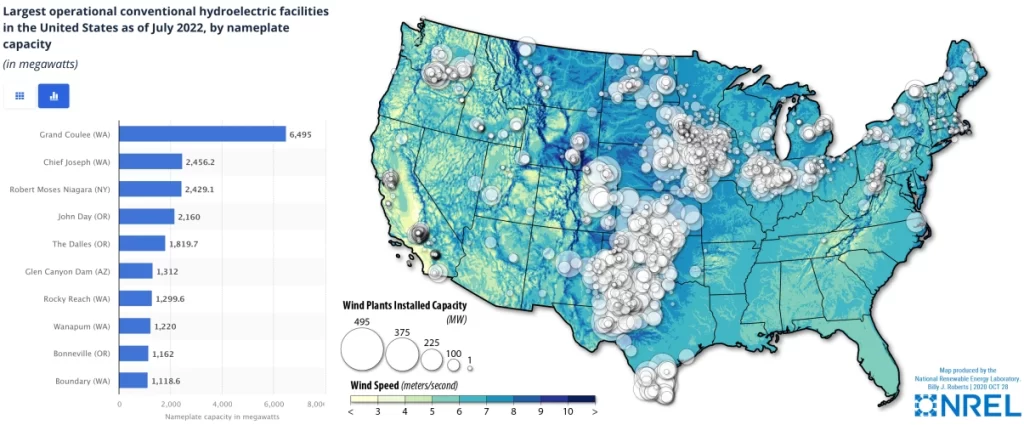
HYDRO: I first notice the big blue dots. Most of them are in WA. There’s also a sizable one I believe near Niagara. Statista told me that indeed the top two hydro-electricity plants were in WA. Also Robert Moses Niagara comes in at third place. Why are there so many in WA? Here it says it’s because the Columbia River provides good potential for hydropower and agriculture. Roosevelt developed the river through New Deal in the 1930s. California has quite a bit in the eastern mountain ranges.
WIND: I can immediately notice that they are scattered in the west north central and west south central regions. Here it says the top 5 states for wind are Texas, Iowa, Oklahoma, Kansas and Illinois, so indeed it aligns. It’s due to great wind resources in the central plains.
On Nuclear
As we have observed earlier, the nuclear generated about 800TWh in 2022. The capacity is around 95GW in 2022. The number of reactors peaked in 1990 and gradually decreased. It was consistently decreasing until 2023. There may have been a mix of commissioning and decommissioning, so we cannot say there were no new reactors built since 2000 just from this. Interestingly, capacity was greatest in these three years. 1990 (99.62GW), 1996(100.78GW), 2012(101.42GW) – not really sure why the nuances happen.
Source: NEI, Britannica
Red dots are 2022 largest US cities by population from Britannica, overlayed on NEI’s visual
Here I overlayed the biggest cities in the US on top of the nuclear plants just out of curiosity. There are 94 reactors in 53 plants.
Source: EIA
The US leads when it comes to nuclear power. In France, nuclear accounts for 68%. That’s amazing. South Korea has a pretty sizable portion generated by nuclear. A simple calculation yields 12,300kWh per capita in the US and 11,300kWh in South Korea. So quite similar. According to EIA, the average US resident purchased 10,791kWh in 2022. Residential PV systems are growing, so the actual usage will be more that this. Although, I am not sure if the table above included non-metered PVs. Anyways, around 11,000kWh per person it is.
Conclusion
Q1. What is US electricity generation
per technology?
2023 total generation is 4.2PWh. Natural gas 45%, coal 15%, nuclear 20%, wind 10%, solar 5%, hydro 5%. Approximately.
Q2. How many nuclear plants
are there in the US
53 plants. 94 reactors. Number of reactors peaked in 1990 at 112 reactors.
Q3. Demand for electricity going up quite a bit
"for the first time in a long time"?
It’s true. Electricity generation plateaued since 2010.
Q4. What are gen 1,2,3 reactors
and how is Terrapower's sodium different?
This post is getting too long. I will cover in a separate post.
Written from scratch by Meston Ecoa
May contain incorrect data and information